The ETF Lab
ETF Spotlight: An effective global equity solution for a modern portfolio
While not every client today wants to discuss sustainable investment options with their advisors, research shows that 73% of investors do.1 At Mackenzie Investments, we strive to provide advisors with the investment tools they need to meet their client’s investment objectives.
In today’s spotlight, we’ll look at Mackenzie Investments newest ETF – Mackenzie Corporate Knights Global 100 Index ETF (MCKG).
Introducing MCKG – Mackenzie Corporate Knights Global 100 Index ETF
- Core global equity holding: MCKG is an all-in-one, core global equity solution that brings together the top 100 sustainability leaders worldwide, according to Corporate Knights.

- Consistent index outperformance vs. traditional global equity peers: The Corporate Knights Global 100 Index outperformed 95% of peers from the global equity category over the last 10 years.
 Source: Morningstar. December 2022. Gross of returns. Global Equity category refers to Canadian funds + ETFs in Morningstar; # of investments: 1 year: 1,918, 3 years: 1,633, 5 years: 1,323, 10 years: 640, 15 years: 312. Index performance does not include the impact of fees, commissions, and expenses that would be payable by investors in the investment products that seek to track an index. Past performance is not necessarily indicative of any future results.
- Responsibly run businesses create shareholder value: The Corporate Knights Global 100 Index, tracked by MCKG, has historically outperformed the MSCI ACWI Index since it’s inception in 2005.
 Source: Morningstar, as of February 2023. Results in CAD, gross of fees. Past performance is not necessarily indicative of any future results. Index performance does not include the impact of fees, commissions, and expenses that would be payable by investors in the investment products that seek to track an index. Past performance is not necessarily indicative of any future results.
- Diversified and well-priced: MCKG is equal weighted (1% weighting in each company) and has a 0.50% management fee.
A closer look under the hood
To rank among the “Global 100”, companies must pass screens for financial strength and score well on 25 measures of sustainability. The index is equally weighted to mitigate single stock concentration risk, while the sector allocation aligns with the MSCI ACWI. However, unlike the MSCI ACWI, the Corporate Knights Global 100 Index has less concentration in North America, acting as a true global equity solution for Canadian investor portfolios.
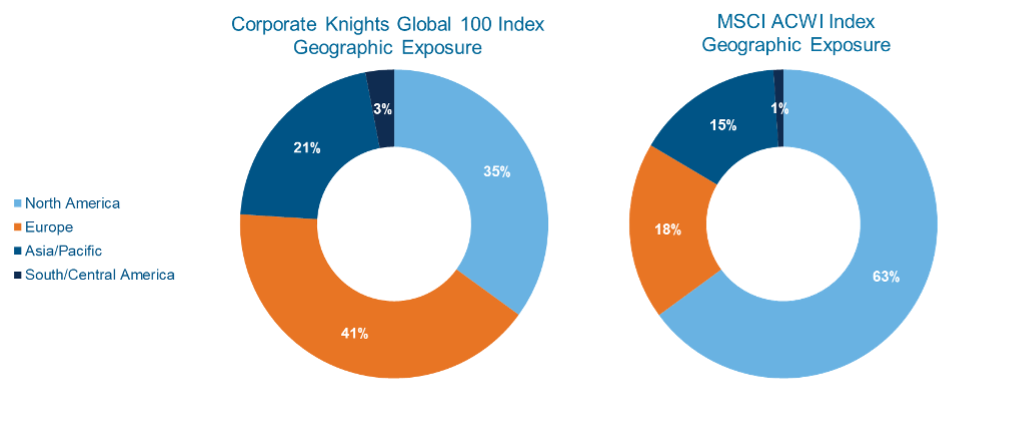 Source: Bloomberg. December 2022.
More resources on MCKG
To learn more on this ETF, please contact your Mackenzie wholesaling team. Additionally, see these resources below:
- The smart way to invest in sustainable leaders with Corporate Knights
- Mackenzie Corporate Knights Global 100 Index ETF | Mackenzie Investments
- Toby Heaps on sustainable investing and Corporate Knights Global 100 Index | Mackenzie Investments Podcast Series
For another perspective, consider reading through Rob Carrick’s piece from last week discussing MCKG in The Globe and Mail - link here.
Mackenzie Investments suite of sustainable solutions
For more on our full suite of sustainable investing solutions visit us at: Sustainable solutions | Mackenzie Investments.
ETF News & Notes
Current yield levels across US and Canadian fixed income
Yields across much of the fixed income universe today are much more attractive than at the start of last year. This higher yield provides a much larger buffer against the risk of rising rates.
Below we show the change in Yield-To-Maturity for several index bond ETFs over the past 15 months.

 Source: Mackenzie Investments; as of March 31, 2023
Why EM debt may be worth a second look
For some investors, emerging markets are outside of their comfort zone. However, as Mackenzie Investment’s Co-Head of Fixed Income, Konstantin Boehmer, notes in his latest post currently, “emerging markets, particularly local currency bonds, presents an opportunity that investors should consider.”
In this piece, Konstantin explains EM debt offers: 1) attractive valuations; 2) diversification benefits; 3) currency appreciation potential; and 4) can act as a potential inflation hedge.
Investors looking for index exposure to EM bonds can consider the two EM debt ETFs below:
 Source: Mackenzie Investments; as of April 21, 2023
 Source: Morningstar; as of April 21, 2023
EM hard currency debt and EM local currency debt are discrete asset classes that exhibit different credit quality and regional composition. For longer term investors, a blended approach can be an effective way to diversify across a range of different countries, instruments and currencies.
Tax considerations when investing in US listed ETFs
As we noted in our piece (“Why Canadian investors should consider Canadian-listed ETFs”), investors allocating to ETFs that primarily invest in foreign securities, particularly asset classes like EM fixed income, should be aware of the withholding taxes that can occur in certain situations.
While investing in well-known US listed ETFs is common in Canada, in some instances this may lead to investors paying an additional level of withholding taxes – potentially impacting total returns.
For a more detailed look into this impact, see our white papers on this topic:
ETF Flows Update
- The Canadian aggregate fixed income category has led fixed income ETF flows YTD, attracting over $1B in net flows YTD. This has been partially offset by sizeable outflows YTD from the Canadian short term bond ETF category which has seen outflows of over $712M.
- The international equity index ETF category has led ETF flows in Canada YTD, pulling in a combined ~$1.37B thus far; non-North American equity ETFs in general have attracted flows. Market cap weighted EM equity ETFs have attracted ~$53.4M month-to-date and ~$283.6M YTD. While, Chinese equity focused ETFs have pulled in an outsized ~$127.2M YTD.2
Mackenzie ETF Top Performers


Source:
1: 2022 RIA Investor Opinion Survey
2: Bloomberg, Mackenzie Investments; all data as of April 19, 2023, unless otherwise noted
FOR ADVISOR USE ONLY. No portion of this communication may be reproduced or distributed to the public as it does not comply with investor sales communication rules. Mackenzie disclaims any responsibility for any advisor sharing this with investors.
Commissions, brokerage fees, management fees, and expenses all may be associated with ETF investments. Please read the prospectus before investing. The indicated rates of return are the historical annual compounded total returns, including in share or unit value and reinvestment of distributions and does not take into account sales, redemption, distribution, or optional charges or income taxes payable by any securityholder that would have reduced returns. ETFs are not guaranteed, their values change frequently, and past performance may not be repeated.
This document may contain forward-looking information which reflect our or third party current expectations or forecasts of future events. Forward-looking information is inherently subject to, among other things, risks, uncertainties and assumptions that could cause actual results to differ materially from those expressed herein. These risks, uncertainties and assumptions include, without limitation, general economic, political and market factors, interest and foreign exchange rates, the volatility of equity and capital markets, business competition, technological change, changes in government regulations, changes in tax laws, unexpected judicial or regulatory proceedings and catastrophic events. Please consider these and other factors carefully and not place undue reliance on forward-looking information. The forward-looking information contained herein is current only as of April 25, 2023. There should be no expectation that such information will in all circumstances be updated, supplemented, or revised whether as a result of new information, changing circumstances, future events or otherwise.
The content of this article (including facts, views, opinions, recommendations, descriptions of or references to, products or securities) is not to be used or construed as investment advice, as an offer to sell or the solicitation of an offer to buy, or an endorsement, recommendation or sponsorship of any entity or security cited. Although we endeavour to ensure its accuracy and completeness, we assume no responsibility for any reliance upon it.
Index performance does not include the impact of fees, commissions, and expenses that would be payable by investors in the investment products that seek to track an index.