The ETF Lab
ETF Spotlight: How to compare total cost of ownership among index ETFs?
Many investors start with management fees when comparing index ETFs. As a recurring cost, this is a good place to start, but it shouldn’t be where your comparison ends.
Below, we outline four factors to consider when comparing the total cost of ownership among similar index ETFs.
1) Expense ratios:
Management expense ratio (MER) includes the fund’s management fee and other regular operating expenses such as legal expenses and index licensing fees. Trading expense ratio (TER) includes the portfolio trading costs.
2) ETF structure and taxes:
How an ETF gains exposure to the underlying securities can have a material impact on the total cost of ownership. In particular, foreign withholding taxes can, in some cases, greatly outweigh management fees in terms of the annual impact on the total cost of ownership. See our prior piece “Tax optimization using Canadian-listed ETFs” for more on this topic.
3) Excess return and tracking error:
Tracking error (TE) and excess return are critical measures of how well the ETF delivers the exposure you’re looking for. Often these terms are used interchangeably, however, while excess return measures the difference between the return of the ETF and its underlying index, tracking error measures the variability of this difference.

TE will be impacted by expense ratios, but also portfolio management efficiency such as the cost of rebalancing, cash flow management and overall product structure. For tracking error, the closer to zero, the better the ETF has tracked its index.
If you’d like to see more on this topic, consider reading our article: What are excess return and tracking error? And why are they important?
4) Trading costs (spread plus any commission paid to transact):
Costs arising from trading ETFs generally include the following: spread cost, premiums/discounts in the market price compared to the NAV of the ETF and any commission paid to transact.
These costs occur only when you buy or sell ETFs. Therefore, the longer the holding period, the greater the impact management fee differences have on the total cost calculation, relative to trading costs.
Finally, when comparing the spread cost between two similar ETFs, be sure to compare the spread on a percentage basis rather than on an absolute dollar basis. For instance, a 0.10% spread on an ETF with a $100 NAV amounts to 10 cents, which is the equivalent to a spread of 2 cents for an ETF with a $20 NAV.
Accounting for the total cost of ownership
Below, we’ve outlined a rough guideline of how trading size and the expected holding period may impact how these different factors should be weighed.

ETF News & Notes
Reconsidering preferred share allocations
The 2023 federal budget proposed to tax financial institutions on dividends received from Canadian preferred shares – securities which were previously exempt from business income. As the preferred share market continues to shrink, liquidity continues to deteriorate for the remaining outstanding preferred shares. Preferred share valuations have consequently declined as markets search for alternative buyers under sustained selling pressure. To learn more on this topic, you can read our article ‘Reconsidering preferred share allocations’.
As central banks near an end to their rate hiking cycle, now may be a good opportunity to reduce preferred share holdings in favour of corporate bond exposures. Canadian investment grade corporate bonds have outperformed preferred share allocations over the last 5 years, with materially lower volatility.
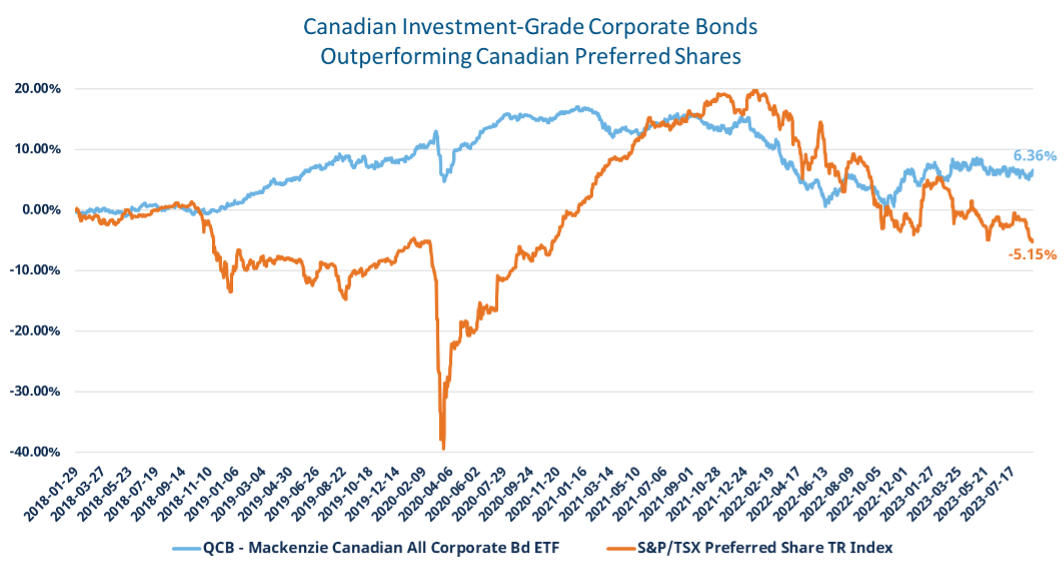 Source: Morningstar, Mackenzie Investments; period: 2018-01-29 to 2023-08-31.
According to Morningstar, the S&P/TSX Preferred Share Index had an annual standard deviation of 14.47 vs. 5.37 for QCB during this period.
Source: Morningstar, Mackenzie Investments; period: 2018-01-29 to 2023-08-31.
According to Morningstar, the S&P/TSX Preferred Share Index had an annual standard deviation of 14.47 vs. 5.37 for QCB during this period.
QCB - (Mackenzie Canadian All Corporate Bond Index ETF) offers Canadian advisors index exposure to Canadian investment grade corporate bonds. QCB currently has weighted average yield-to-maturity of 5.54%.1
Canadian ETF insiders sound off on CSA review
Prerna Mathews, Vice President of ETF Product Strategy at Mackenzie Investments, was recently quoted in Wealth Professional discussing changes that the Canadian Securities Administrators (CSA) can consider during its review of the ETF space.
Prerna touched on two important issues: (i) the lack of transparency offered by some providers on daily holdings to market makers and (ii) the murkiness of mutualized costs.
Why it’s best to be aware of the time when trading international ETFs
International markets in which international equity/bond ETFs invest in, may be closed when North America is open for trading.
If the underlying securities in the ETF are not trading, this potentially makes it more difficult for market makers to accurately price the ETF and hedge their risk, which may lead to wider spreads when trading the ETF. Therefore, it may be preferable to trade these ETFs when the underlying securities are also trading, if possible.
As shown in the table below, while Asian markets are closed, European markets are still open as US and Canadian securities begin trading. Therefore, when trading international equity ETFs for instance, the greatest percentage of the underlying securities will likely be trading prior to 11am.
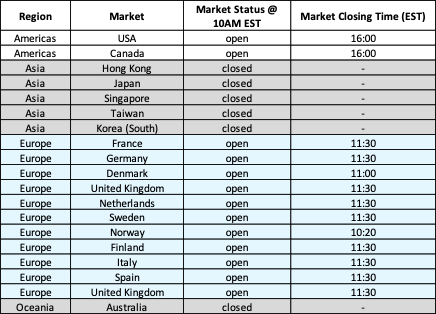 Source: Bloomberg, Mackenzie Investments
For more ETF trading best practices, see our piece: ETF Trading Best Practices.
ETF Flows Update
- Taking a longer term look at flows this week, roughly 75% of ETF flows over the last three years have gone into ETFs with management fees under 0.30%. The Canadian ETF industry has grown at a ~19% CAGR over the last seven years, with total assets over ~$360 billion.
- In August, Canadian ETFs pulled in $2.9 billion in net flows (after adjusting for ETF-of-ETF flows), bringing the YTD net inflows to $25.3 billion.2
Mackenzie ETF Top Performers


Source:
1: Bloomberg; as of August 31, 2023
2: Bloomberg, Mackenzie Investments; all data as of August 31, 2023, unless otherwise noted
FOR ADVISOR USE ONLY. No portion of this communication may be reproduced or distributed to the public as it does not comply with investor sales communication rules. Mackenzie disclaims any responsibility for any advisor sharing this with investors.
Commissions, brokerage fees, management fees, and expenses all may be associated with Exchange Traded Funds. Please read the prospectus before investing. The indicated rates of return are the historical annual compounded total returns, including in share or unit value and reinvestment of distributions and does not take into account sales, redemption, distribution, or optional charges or income taxes payable by any securityholder that would have reduced returns. Exchange Traded Funds are not guaranteed, their values change frequently, and past performance may not be repeated.
The content of this article (including facts, views, opinions, recommendations, descriptions of or references to, products or securities) is not to be used or construed as investment advice, as an offer to sell or the solicitation of an offer to buy, or an endorsement, recommendation or sponsorship of any entity or security cited. Although we endeavour to ensure its accuracy and completeness, we assume no responsibility for any reliance upon it.
This article may contain forward-looking information which reflect our or third party current expectations or forecasts of future events. Forward-looking information is inherently subject to, among other things, risks, uncertainties and assumptions that could cause actual results to differ materially from those expressed herein. These risks, uncertainties and assumptions include, without limitation, general economic, political and market factors, interest and foreign exchange rates, the volatility of equity and capital markets, business competition, technological change, changes in government regulations, changes in tax laws, unexpected judicial or regulatory proceedings and catastrophic events. Please consider these and other factors carefully and not place undue reliance on forward-looking information. The forward-looking information contained herein is current only as of September 13, 2023. There should be no expectation that such information will in all circumstances be updated, supplemented, or revised whether as a result of new information, changing circumstances, future events or otherwise.
Index performance does not include the impact of fees, commissions, and expenses that would be payable by investors in the investment products that seek to track an index.