
Written by the Mackenzie Fixed Income Team
Key Highlights
- Tariffs, immigration constraints, and government layoffs are raising worries about growth, leading to lower bond yields and expectations of three rate cuts in 2025.
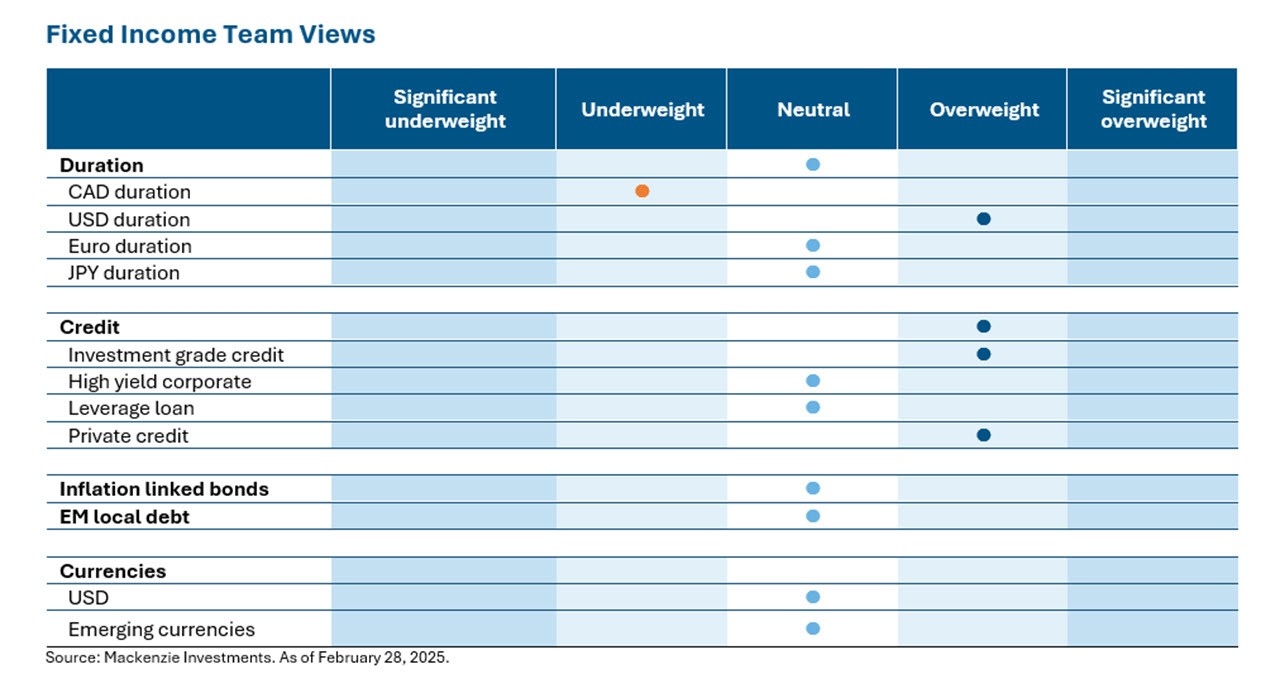
- Tariffs risk deepening the recession in Canada, with leveraged households adding pressure. Increased bond supply may offset revenue losses, and there's a preference for low-duration investment-grade corporates.
- Sold off US inflation-linked bonds, overweight on US long-term government bonds, and maintaining overweight positions in New Zealand duration due to higher yields and potential dovish central bank stance.
- Reduced exposure to high-tariff-risk sectors (autos, consumer discretionary, industrials) and cyclical sectors in Canada (energy, retail, low-back-end banks). Focused on pipelines, utilities, telecoms, and big-5 banks.
Duration and Curve Positioning
Tariffs and the uncertainty around it continued to the focus centre among market participants. In the US there seems to be this growing worry that tariffs coupled with immigration constraints and government layoffs could curb growth. As a reaction to softer growth concerns, bond yields dropped lower with expectation now of three rate cuts in in 2025. Canada, however, faces a different economic landscape. Tariffs pose a significant risk of deepening the recession, compounding the existing pressures from leveraged households. To offset revenue losses, there may be an increased bond supply from the government and provinces, which could partially counterbalance the easy monetary policy stance. Considering these factors, we’ve sold off our exposure to US inflation linked bonds and remain overweight on US duration in long-term government bonds to benefit from a low-growth, low-supply scenario. Notably, the 30-year U.S.–Canada yield gap stands at around 150 basis points suggesting a fundamental difference between the two economies. We find the wider spread to be rare and believe in a re-narrowing of the gap. In Canada, we prefer low duration investment-grade corporates to take advantage of higher policy rate & easing Bank of Canada (BoC) policy.
We maintain our overweight position in New Zealand duration, attracted by the higher competitive bond yields and the potential for a more dovish stance from the central bank. The central bank cut rates by 50bp to 3.75%, down from 5.5.% in July 2024, aiming to revive the stalled economy faced by rising international trade tensions, slower global growth, and geopolitical risks. We believe the risk of incremental divergence in monetary policies is a function of structural country specific differences. Identifying discrepancies between market pricing and expectations is a fundamental part of our selection process.
On the higher yielding bond exposures, we’ve maintained a general tilt to non-cyclical given relative valuations, which is an important context on our risk positioning going into this uncertain market environment. We have lower exposures to sectors at the highest risk of tariffs such as autos, consumer discretionary, and industrials. We have also de-risked our positioning to avoid cyclical exposure by reducing Canadian: energy exposure, retailer exposure, low-back-end bank exposure. Remaining exposure is concentrated in pipelines, utilities, telecoms, and big-5 bank exposure. We believe the next alpha trade will be a factor of active risk management strategies and capitalizing on the inefficiencies created by the political landscape. We have seen much of capital gains flow through 2024 and YTD 2025, incrementally, we expect income to be the key performance driver.
The economic outlook for 2025 is complex, and we continue to assess the attractiveness of the all-in yield given tight credit spreads in the high yield space. A constructive outlook is supported by the change in US leadership, but active management and a conservative approach are crucial for achieving above-average returns.
Central Bank Watch
Region |
Latest CPI Inflation |
Policy rate |
Latest policy action |
Next decision date |
Market expectation |
Outlook |
Canada |
1.90% |
3.00% |
25 bp cut |
12-Mar-25 |
25 bp cut |
Underweight |
United States |
3.00% |
4.50% |
No change |
19-Mar-25 |
No change |
Overweight |
Eurozone |
2.40% |
2.65% |
25 bp cut |
17-Apr-25 |
25 bp cut |
Neutral |
Japan |
4.00% |
0.50% |
25 bp hike |
19-Mar-25 |
No change |
Underweight |
United Kingdom |
3.00% |
4.50% |
25 bp cut |
20-Mar-25 |
No change |
Neutral |
New Zealand |
2.20% |
3.75% |
50 bp cut |
08-Apr-25 |
25 bp cut |
Overweight |
Indonesia |
-0.09% |
5.75% |
No change |
19-Mar-25 |
No change |
Overweight |
Credit Market Performance
Investment Grade Credit (IG)
The risk off move that drove treasury bond yields lower also favoured the high quality corporate bond market returns despite marginal spread widening. US investment-grade (IG) bond yields were lower by 25 basis points to 5.09% on growing recessionary fears, resulting in a monthly return of +2.03%. In contrast, Canadian IG bond underperformed with yields lower by 12 basis points to 3.88%, with a monthly return of +0.92%. We continue to find value in and prefer our exposure to the defensive sectors within the marketplace and active selection in corporate hybrids and bank notes.
High Yield Bonds (HY)
The HY index recorded a gain of +0.63% in February, with CCC-rated bonds underperforming at -0.03%. High-yield bond spreads widened 26bp to 325bp in February with a yield of 7.29%, reflecting decompression across ratings due to growth concerns from tariff threats and recent weaknesses in PMI, spending, consumer confidence, and labor market data. Despite these challenges, returns were solid, supported by lower rates, subdued issuance, and steady inflows. Earnings performance for high-yield companies remained strong, although guidance has been mixed amid significant policy uncertainty.
Leveraged Loans (LL)
The LL Index gained 0.11% in February, down from a 0.72% average over the prior 12 months and a 0.69% return in January. The market-value return, which measures changes in secondary prices, lost 0.50%, detracting from performance offsets by income from coupon clipping. The loan market sentiment soured in February amid tariff concerns, volatility in the equity markets, and the potential effect of a less certain growth picture on borrower fundamentals. As secondary prices tumbled, opportunistic borrowing diminished, and a handful of deals were pulled from the market. Worth noting that Loans YTM at 8.41% is down by nearly 250 bps from their peak of 10.78% in May 2023, after 3 Fed cuts and waves of repricing at lower spreads.
Commissions, trailing commissions, management fees, and expenses all may be associated with mutual fund investments. Please read the prospectus before investing. The indicated rates of return are the historical annual compounded total returns as of February 31, 2025, including changes in share value and reinvestment of all distributions and does not take into account sales, redemption, distribution, or optional charges or income taxes payable by any security holder that would have reduced returns. Mutual funds are not guaranteed, their values change frequently, and past performance may not be repeated. Index performance does not include the impact of fees, commissions, and expenses that would be payable by investors in the investment products that seek to track an index.
Index performance does not include the impact of fees, commissions, and expenses that would be payable by investors in investment products that seek to track an index.
This document may contain forward-looking information which reflect our or third party current expectations or forecasts of future events. Forward-looking information is inherently subject to, among other things, risks, uncertainties and assumptions that could cause actual results to differ materially from those expressed herein. These risks, uncertainties and assumptions include, without limitation, general economic, political and market factors, interest and foreign exchange rates, the volatility of equity and capital markets, business competition, technological change, changes in government regulations, changes in tax laws, unexpected judicial or regulatory proceedings and catastrophic events. Please consider these and other factors carefully and not place undue reliance on forward-looking information. The forward-looking information contained herein is current only as of February 31, 2025. There should be no expectation that such information will in all circumstances be updated, supplemented or revised whether as a result of new information, changing circumstances, future events or otherwise.
The content of this commentary (including facts, views, opinions, recommendations, descriptions of or references to, products or securities) is not to be used or construed as investment advice, as an offer to sell or the solicitation of an offer to buy, or an endorsement, recommendation or sponsorship of any entity or security cited. Although we endeavour to ensure its accuracy and completeness, we assume no responsibility for any reliance upon it.
All information is historical and not indicative of future results. Current performance may be lower or higher than the quoted past performance, which cannot guarantee results. Share price, principal value, and return will vary, and you may have a gain or a loss when you sell your shares. Performance assumes reinvestment of distributions and does not account for taxes. Performance may not reflect any expense limitation or subsidies currently in effect. Short-term trading fees may apply.
This material is for informational and educational purposes only. It is not a recommendation of any specific investment product, strategy, or decision, and is not intended to suggest taking or refraining from any course of action. It is not intended to address the needs, circumstances, and objectives of any specific investor. Mackenzie Investments, which earns fees when clients select its products and services, is not offering impartial advice in a fiduciary capacity in providing this sales and marketing material. This information is not meant as tax or legal advice. Investors should consult a professional advisor before making investment and financial decisions and for more information on tax rules and other laws, which are complex and subject to change.
The rate of return is used only to illustrate the effects of the compound growth rate and is not intended to reflect future values of the mutual fund or returns on investment in the mutual fund.