
Written by the Mackenzie Fixed Income Team
Key Highlights
- The US Federal Reserve (Fed) and the Bank of Canada (BoC) continue to reluctantly remain ‘on hold’ awaiting further proof that inflation is sustainably headed to the target 2%.
- We continue to believe inflation trending lower and weaker labor markets in Canada might lead to divergence in monetary policy actions for BoC versus the U.S Fed.
- We prefer to be invested in high-grade corporate bonds at the short end of the curve and prefer the Canadian yield curve over the US in this segment.
- We remain cautious on high yield over potential economic slowdown concerns in a higher for longer rate environment amid tighter corporate spreads (expensive valuations).
- We maintain our strategic position in long-dated TIPS, anticipating that inflation, while potentially peaking, will remain above historical norms for an extended period.
Fixed Income Team Views
Central Bank Watch
US Fed (Fed)
Stubborn inflation pressures persisted in March with headline inflation of 3.5% y/y and Core CPI at 3.8% y/y, both rose higher than expected. US payrolls advanced by 303,000, the most in nearly a year and the unemployment rate fell to 3.8%, pointing to a strong labor market. Strong economic data points to a resilient economy and further led to heightened risks of delayed Fed easing.
Bank of Canada (BoC)
Canadian inflation reaccelerated slightly to 2.9% y/y, while core metrics showed further disinflation progress. Canada’s labor market unexpectedly lost jobs and the unemployment rate jumped to 6.1%, the highest level in more than two years, signaling greater slack in the economy. While the BoC kept rates unchanged, we continue to believe inflation trending lower and weaker labor markets might lead to policy rate action divergence for BoC versus the Fed with the balance of risks shifting towards a June easing.
European Central Bank (ECB)
The ECB held rates at 4.50%, but essentially confirmed to reduce interest rates at its next meeting in June, although the Governing Council has been non-committal on additional moves after that. The Mar’24 annual headline inflation fell to 2.4% so did the core to 2.9%, both 20 bps lower than the previous print providing further confidence. The upcoming wage growth data, very much emphasized by Lagarde, should provide clues to price in forward policy rate expectations. We believe ECB to out dove the Fed and favour Euro duration exposure particularly in our global mandates.
Bank of Japan (BoJ)
The yen fell sharply against the dollar, briefly reaching 158.44 yen per dollar, the weakest yen-dollar level in about 34 years since May 1990. Post the policy change, JGBs will likely trade more openly in the market, although the government will continue to adjust the size of it bond auction offerings as it sees fit. Although the BoJ’s hiking cycle will be slow, we continue to see another 25bp hike this year followed by an additional 25bp in early 2025 with risks of more rather than less because of higher domestic wages, coupled with higher imported energy prices that are causing additional hardships for low- and middle-income earners, and negatively affecting approval ratings for the government.
Emerging Markets (EM)
Most of the losses were triggered by EM FX weakness. Elevated UST yields and persistent USD strength remain key headwinds to the performance of the EM LCY asset class. Inflation dynamics remain a tailwind for the market; inflation has fallen significantly from cycle peaks across Latam economies. This should allow central banks to continue to ease very tight monetary policy stances, and in some cases to accelerate the pace of easing. With many emerging market peers having already entered an established easing cycle, Mexico looks primed to capitalize on the positive impact of future rate cuts
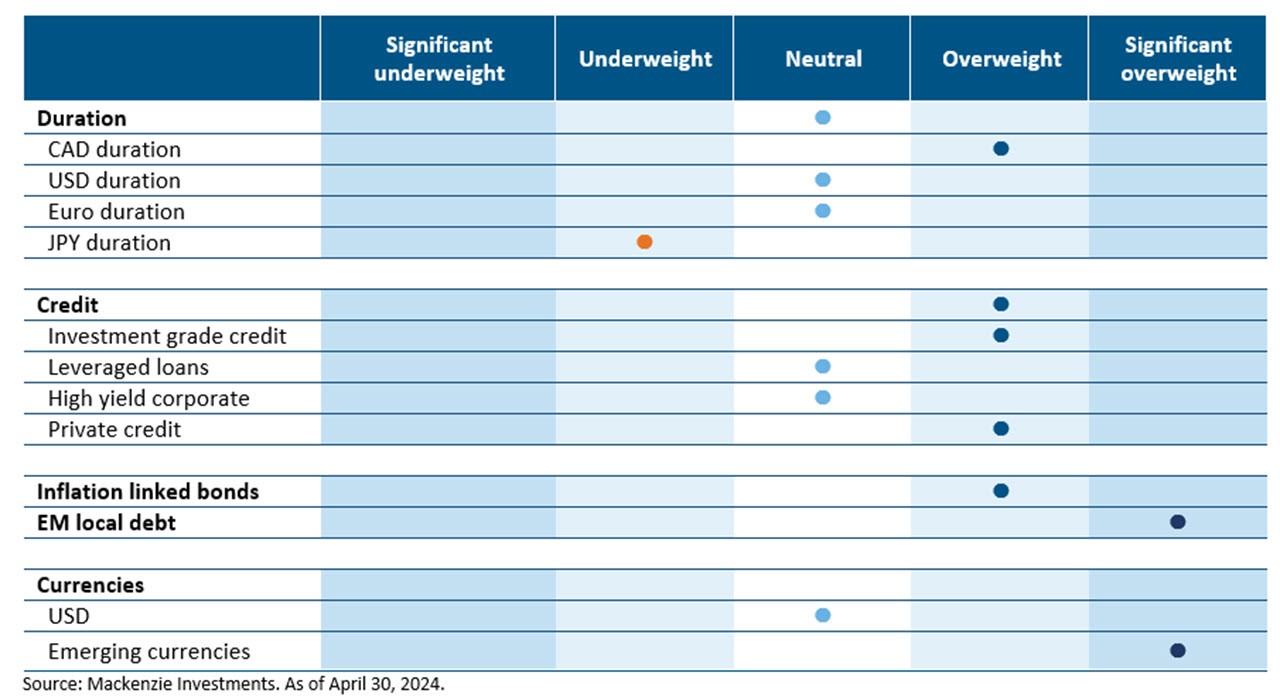
Duration and Curve Positioning
We prefer to be invested in high-grade corporate bonds at the short end of the curve and prefer the Canadian curve over the US curve in this sector. With fragilities seemingly on the horizon in the Canadian market, led by the growing strains on consumers caused by mortgage resets, there is, in addition to the elevated yield, the potential for significant price appreciation of these securities. The longer end of the Canadian market remains less convincing with 30y Canadian bonds yield some 100bps less than their US equivalents, making the US more attractive. Should the two central banks indeed pivot away somewhat from their laser focus on inflation, this could have a positive effect on inflation linked-bonds relative to nominal bonds. We maintain a positive stance on duration in North America, particularly in Canada, and continue to maintain a significant active underweight duration view in regions where rates are expected to rise further, notably Japan. We continue to hold a long position in Emerging Market (EM) local rates for the attractive carry and prospect for lower rates in Latam.
Investment Grade Corporates (IG)
In March, the IG Credit index detracted from performance with a return of -1.27% in Canada and -2.33% in the US as yields rose ~40 bps on the back of higher for longer narrative, enforcing market to recalibrate rate cut expectations. The IG spreads keep grinding tighter in the US and are now below 100bps, supported by stronger economic data and earnings. We favour the investment grade corporate bond space from a total return perspective and more so on the front end of the Canadian curve which is influenced by the policy actions from BoC.
High Yield bonds (HY)
High yield bonds returned -0.87% in April amid resurfacing geopolitical tensions, equity declines, the first outflows of 2024, and higher treasury yields in response to recalibrated Fed expectations. High-yield bond yields and spreads increased 44bp and 0bp in April to 8.27% and 343bp. Meanwhile, CCC-rated bonds continued its underperformance amid rise in idiosyncratic credit situations. Decreasing yields typically benefit credit spreads by lowering funding costs for companies and boosting consumer purchasing power. However, we're cautious because rate cuts, especially in an economy sliding deeper into recession (which is more probable in Canada), would reverse these effects. Additionally, the narrow credit spreads indicate an unfavorable entry point for taking on significant credit risk.
Leveraged loans (LL)
The US leveraged loan secondary market rally stalled in April as investors confronted a hawkish tilt in rate progressions and intensifying global conflicts. The asset class returned 0.60% thanks to coupon-clipping, while high yield bonds and equities posted losses. Staying on trend, loan refinancings and repricings dominated issuance in April, leaving net supply limited. We reflect our neutral view on loans as we see a good opportunity to receive higher coupons & favour higher quality loans in the current economic cycle.
Bond stories
Investment Grade - Short 10-year Japanese Government Bonds (JGB)
Since April 2022, we have held a short Japanese Government Bond position as a structural macro trade based on the idea the Bank of Japan (BoJ) was keeping both cash rates and the policy rate artificially low to ease financial conditions and reflate the economy. With domestic inflation at higher levels yields & in a move away from controlling rates and towards easing financial conditions, the BoJ hiked rates and opted to shed its Yield Curve Control program which was acting as a yield suppressant. We have taken some profit on our short JGB trades as some of the original rationale for the trade has come to fruition but continue to see additional upside in the quarters ahead if the BoJ continues along its hawkish path.
High Yield Bond – Fage
Fage, a leading branded Greek yogurt producer, excels in the plain Greek yogurt market across key regions including Greece, the U.S., the U.K., and Italy. As long-term lenders to FAGE, we are attracted to its strong brand recognition, prudent capital allocation strategy, and the strong Greek yogurt market. FAGE has demonstrated proactive debt reduction efforts since its leverage peak in 2019, significantly slashed debt by 75% through multiple rounds of tender offers. Consequently, its leverage ratio has improved substantially from 5x to 1-2x. Moreover, Fage has exhibited improving operating performance in 2023, driven by net average selling price increases, favorable trends in milk prices, and reduced energy costs. With solid cash flow generation, we anticipate Fage may pursue further debt repurchases for its 5.625s bonds when call prices hit par in August 2024. This expectation of additional bond repurchases has contributed to the outperformance of FAGE's bonds relative to the broader high-yield market in April 2024.
ESG – Kruger Products
Kruger Products is Canada’s leading manufacturer of quality tissue products for household, industrial and commercial use. They serve the Canadian consumer market with such well-known brands as Cashmere, Purex, SpongeTowels, Scotties, White Swan, and Bonterra. The company reported full year sales of $1.9 billion and record Adjusted EBITDA of $238.5 million, driven by robust volume and improved margins due to lower pulp input costs. We consider Kruger Products to be best-in-class ESG primarily because they launched their first formal sustainability program in 2010 and achieved most of their sustainability goals by 2020: 100% third-Party Certified Fibre, 15% reduction in Scope 1 and 2 GHG emissions, 41% reduction of water consumption, 5% reduction in virgin plastics packaging in branded products, 63% improvement in employee health and safety, 1st Canadian tissue manufacturer to earn FSC certification (2011), and 1st biomass gasification system in Canadian pulp and paper industry. Going forward, the sustainability program is equally impressive with a full Reimagine 2030 campaign that includes the following sustainability targets: to utilize 100% third-party certified fibres, to reduce Scope 1 and 2 GHG emissions by 35% (from 2015 base year), to reduce water consumption by 35%, and to reduce virgin plastic packaging in branded products by 50%.
Commissions, trailing commissions, management fees, and expenses all may be associated with mutual fund investments. Please read the prospectus before investing. The indicated rates of return are the historical annual compounded total returns as of April 30, 2024, including changes in share value and reinvestment of all distributions and does not take into account sales, redemption, distribution, or optional charges or income taxes payable by any security holder that would have reduced returns. Mutual funds are not guaranteed, their values change frequently, and past performance may not be repeated. Index performance does not include the impact of fees, commissions, and expenses that would be payable by investors in the investment products that seek to track an index.
Index performance does not include the impact of fees, commissions, and expenses that would be payable by investors in investment products that seek to track an index.
This document may contain forward-looking information which reflect our or third party current expectations or forecasts of future events. Forward-looking information is inherently subject to, among other things, risks, uncertainties and assumptions that could cause actual results to differ materially from those expressed herein. These risks, uncertainties and assumptions include, without limitation, general economic, political and market factors, interest and foreign exchange rates, the volatility of equity and capital markets, business competition, technological change, changes in government regulations, changes in tax laws, unexpected judicial or regulatory proceedings and catastrophic events. Please consider these and other factors carefully and not place undue reliance on forward-looking information. The forward-looking information contained herein is current only as of April 30, 2024. There should be no expectation that such information will in all circumstances be updated, supplemented or revised whether as a result of new information, changing circumstances, future events or otherwise.
The content of this commentary (including facts, views, opinions, recommendations, descriptions of or references to, products or securities) is not to be used or construed as investment advice, as an offer to sell or the solicitation of an offer to buy, or an endorsement, recommendation or sponsorship of any entity or security cited. Although we endeavour to ensure its accuracy and completeness, we assume no responsibility for any reliance upon it.
All information is historical and not indicative of future results. Current performance may be lower or higher than the quoted past performance, which cannot guarantee results. Share price, principal value, and return will vary, and you may have a gain or a loss when you sell your shares. Performance assumes reinvestment of distributions and does not account for taxes. Performance may not reflect any expense limitation or subsidies currently in effect. Short-term trading fees may apply.
This material is for informational and educational purposes only. It is not a recommendation of any specific investment product, strategy, or decision, and is not intended to suggest taking or refraining from any course of action. It is not intended to address the needs, circumstances, and objectives of any specific investor. Mackenzie Investments, which earns fees when clients select its products and services, is not offering impartial advice in a fiduciary capacity in providing this sales and marketing material. This information is not meant as tax or legal advice. Investors should consult a professional advisor before making investment and financial decisions and for more information on tax rules and other laws, which are complex and subject to change.
The rate of return is used only to illustrate the effects of the compound growth rate and is not intended to reflect future values of the mutual fund or returns on investment in the mutual fund.