Highlights
- Global equity markets are certainly not cheap, but valuations aren’t (yet) at extremes.
- Macro and technical factors are constructive enough to outweigh the expensive valuations, leaving us broadly neutral in our exposure to stocks.
- We overweight international stocks, where valuations are less prohibitive than in the US and Canadian markets.
The hardest question for an asset allocator in 2024 is “when should I start selling stocks”? Whichever is one’s preferred valuation measure, global stocks are in the first decile of “expensiveness” compared to history. But pricy valuations, by themselves, aren’t a convincing trigger to underweight stocks, unless they reach unjustifiable, extreme levels. Tallying up tailwinds and headwinds, expensive valuations are more than compensated by positive macro forces and cheery investor sentiment signals. Accordingly, we’re not ready to underweight stocks.
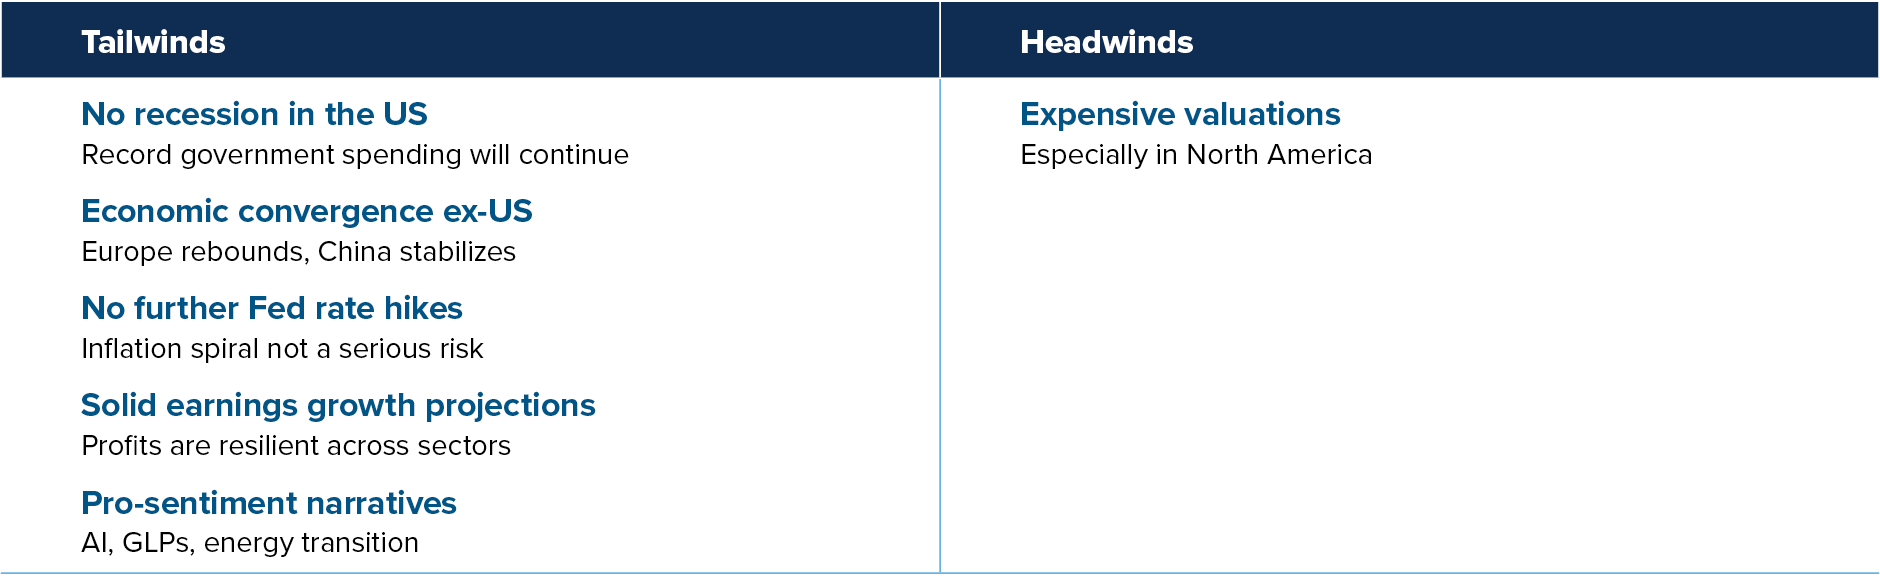
Many reasons to buy, one big reason to sell
Tailwinds and headwinds for stock markets
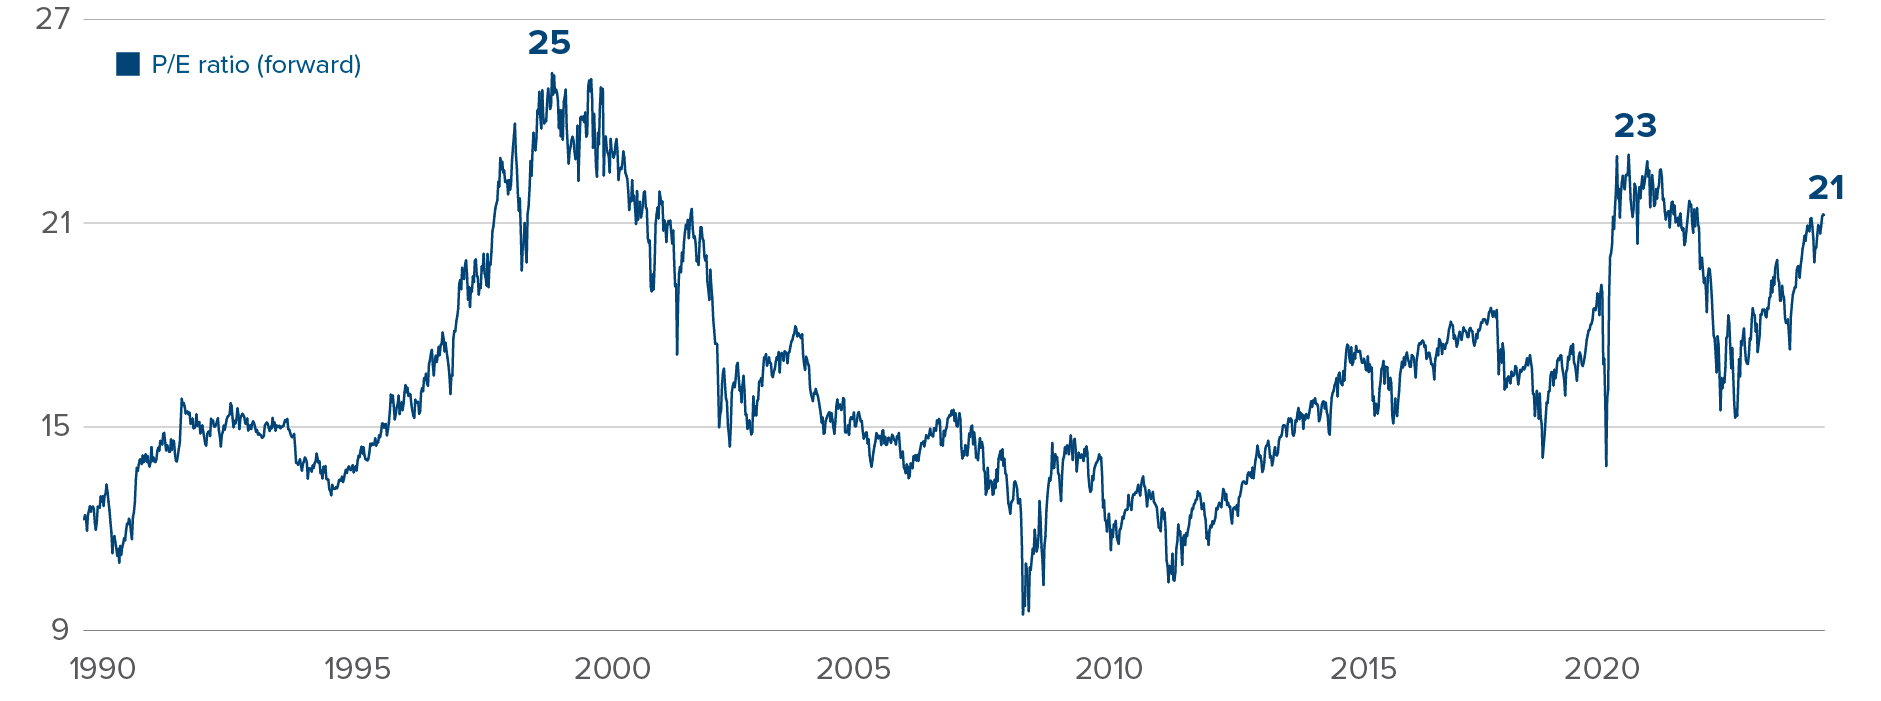
While valuations are stretched, we don’t view them as extreme (yet). The S&P 500 forward price-earnings ratio sits at 21, compared to peaks of 23 in 2021 and 25 in 1999. Stocks are sufficiently expensive to prevent us from aggressively overweighting equities, but not to force us to pull the trigger on an underweight.
Valuations are stretched, but not extreme
Price-earnings ratio, S&P 500
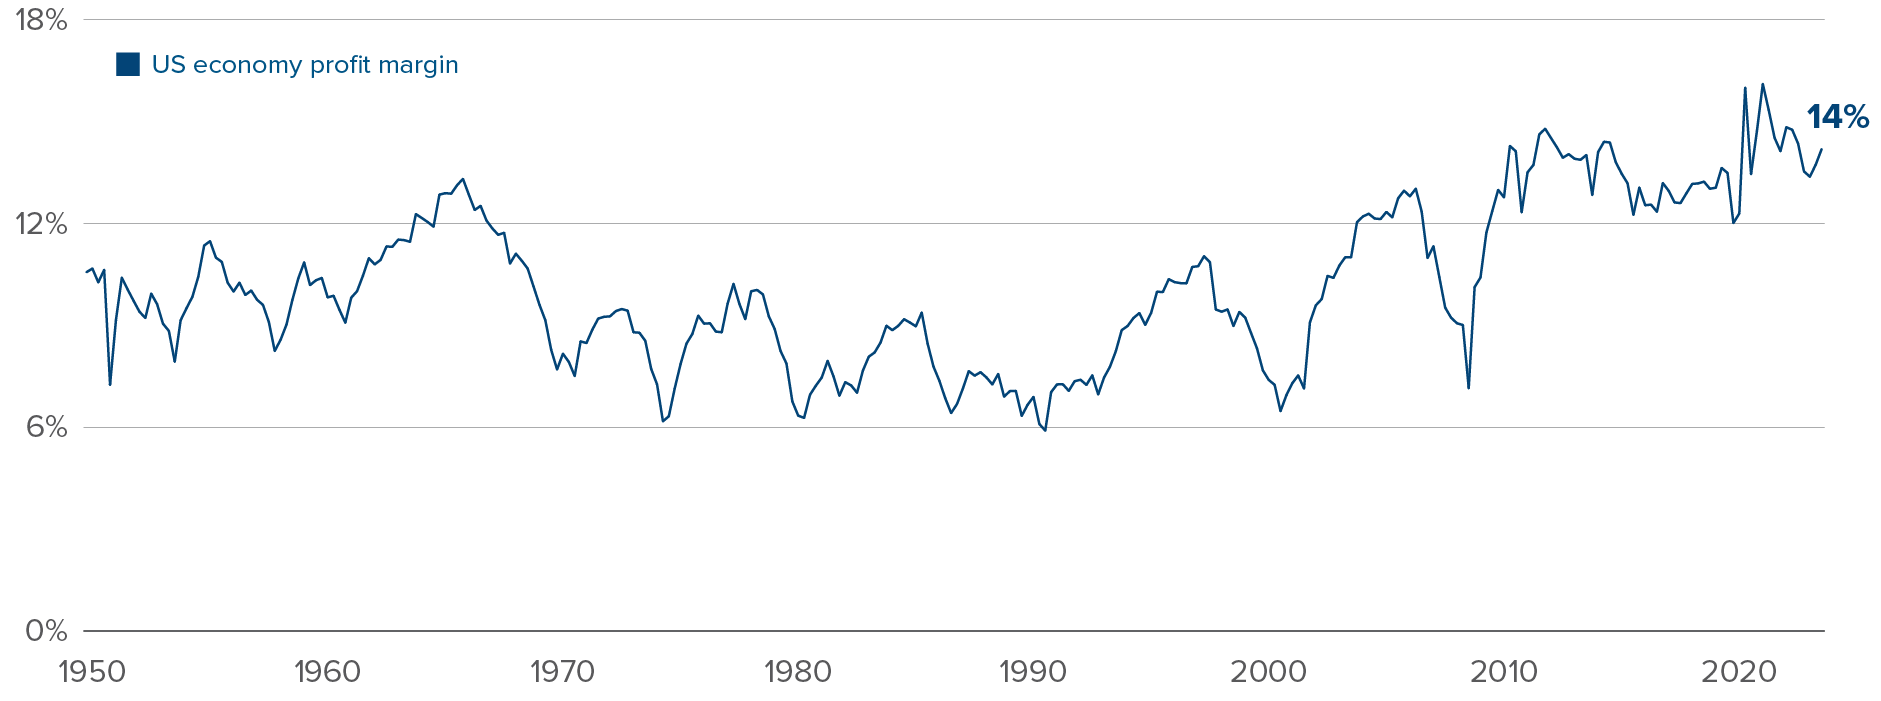
Plus, when comparing with 1990s valuations, we should adjust today’s ratios downwards. Long-run economy-wide profit margins are much higher today than they were 30 years ago. Unionization rates have declined, corporate taxes are lower, and borrowing is cheaper and more accessible, even with the spike in rates in recent years. This lowers the risk of a reversion to the mean in profit margins, and justifies slightly higher valuations.
Economy-wide profit margins are much higher than they were in the 1990s
Aggregate corporate profit margin, after tax
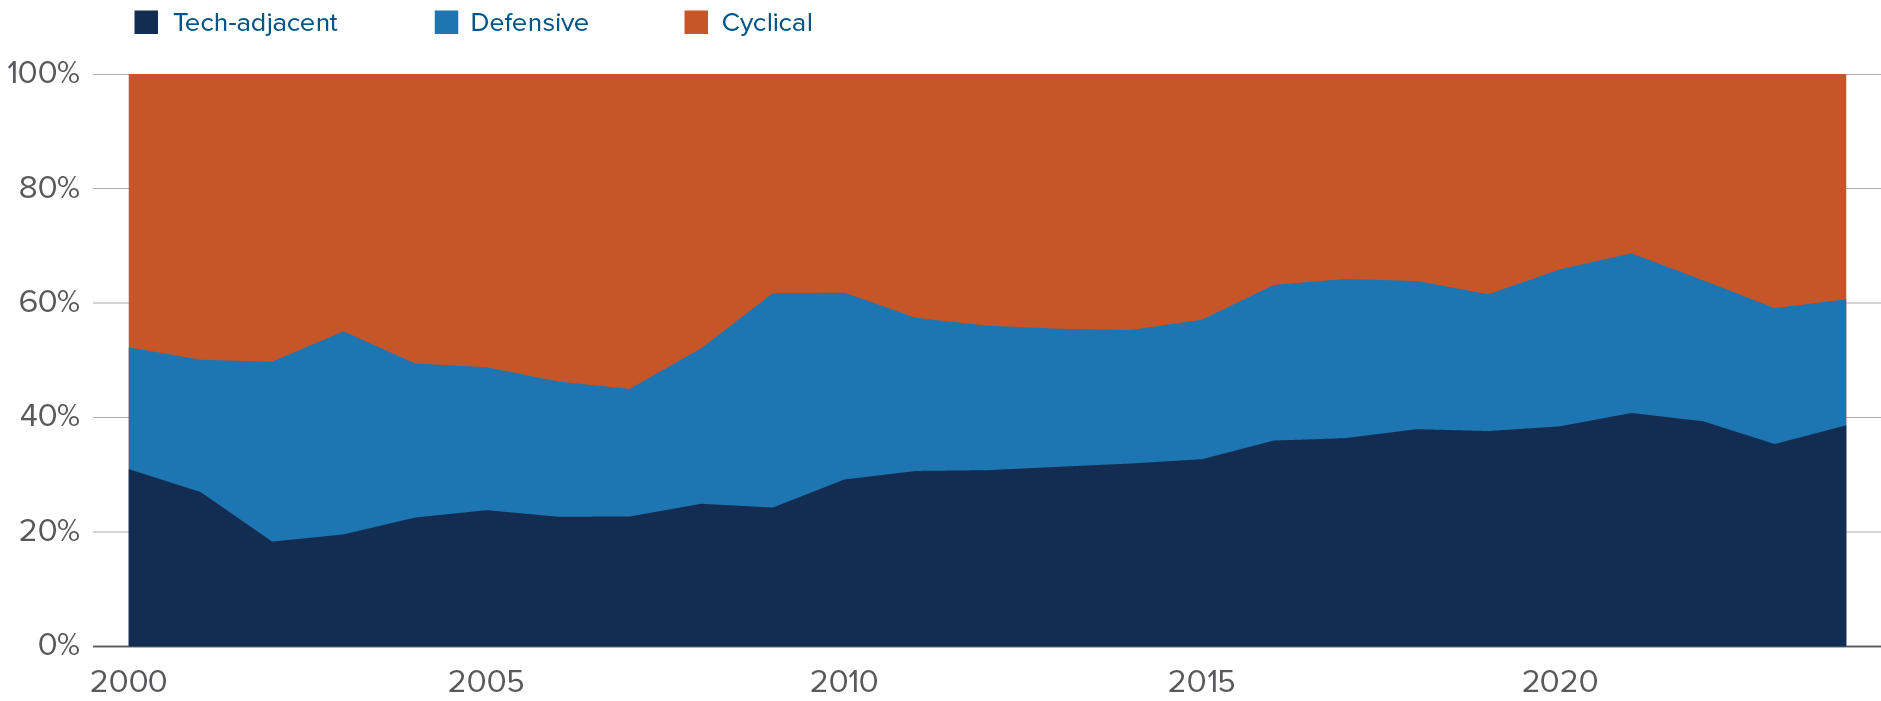
The US stock market of 2024 resembles the 2000s’ S&P 500 in name only. “Tech-adjacent” names make up a much larger proportion of the index. And that high weight isn’t caused by lofty valuations, as was the case at the time of the 1990s tech bubble. The actual economic profits of those companies are much higher than in the 90s. The technology, communication services and consumer discretionary sectors currently make up 52% of the S&P 500’s market cap. But they also account for roughly 40% of the S&P 500’s total earnings, almost double their weight from 20 years ago. And not just from a temporary spike in Nvidia profit margins: these sectors’ combined share of profits has been above 35% for the last eight years.
Not your parents’ S&P 500
Share of total profits by S&P 500 companies
Hence, the US market is not at trading at extreme prices, especially after adjusting for economic context and sector weights. But it is certainly not cheap.
Rather than de-risking from equities in general, we favour diversifying towards cheaper markets. Importantly, we don’t count Canada as one of these more attractive markets. Canadian stocks are not cheaper than US stocks on average. How is that possible, when the TSX boasts a trailing 12-month price-earnings ratio of only 19, well below the S&P 500’s 27? It’s simple: the Canadian stock index is skewed towards low-valuation sectors like energy and financials. Once you adjust the Canadian market for US sector exposures, the TSX price-earnings ratio jumps to 29. On top of these pricy valuations, the Canadian market has seen negative investor flows in recent months, a trend we expect to persist given the tough macro narrative around Canada.
Adjusting for sector exposures, the TSX is not cheaper than the S&P 500
Trailing price-earnings ratio using S&P 500 sector weightings
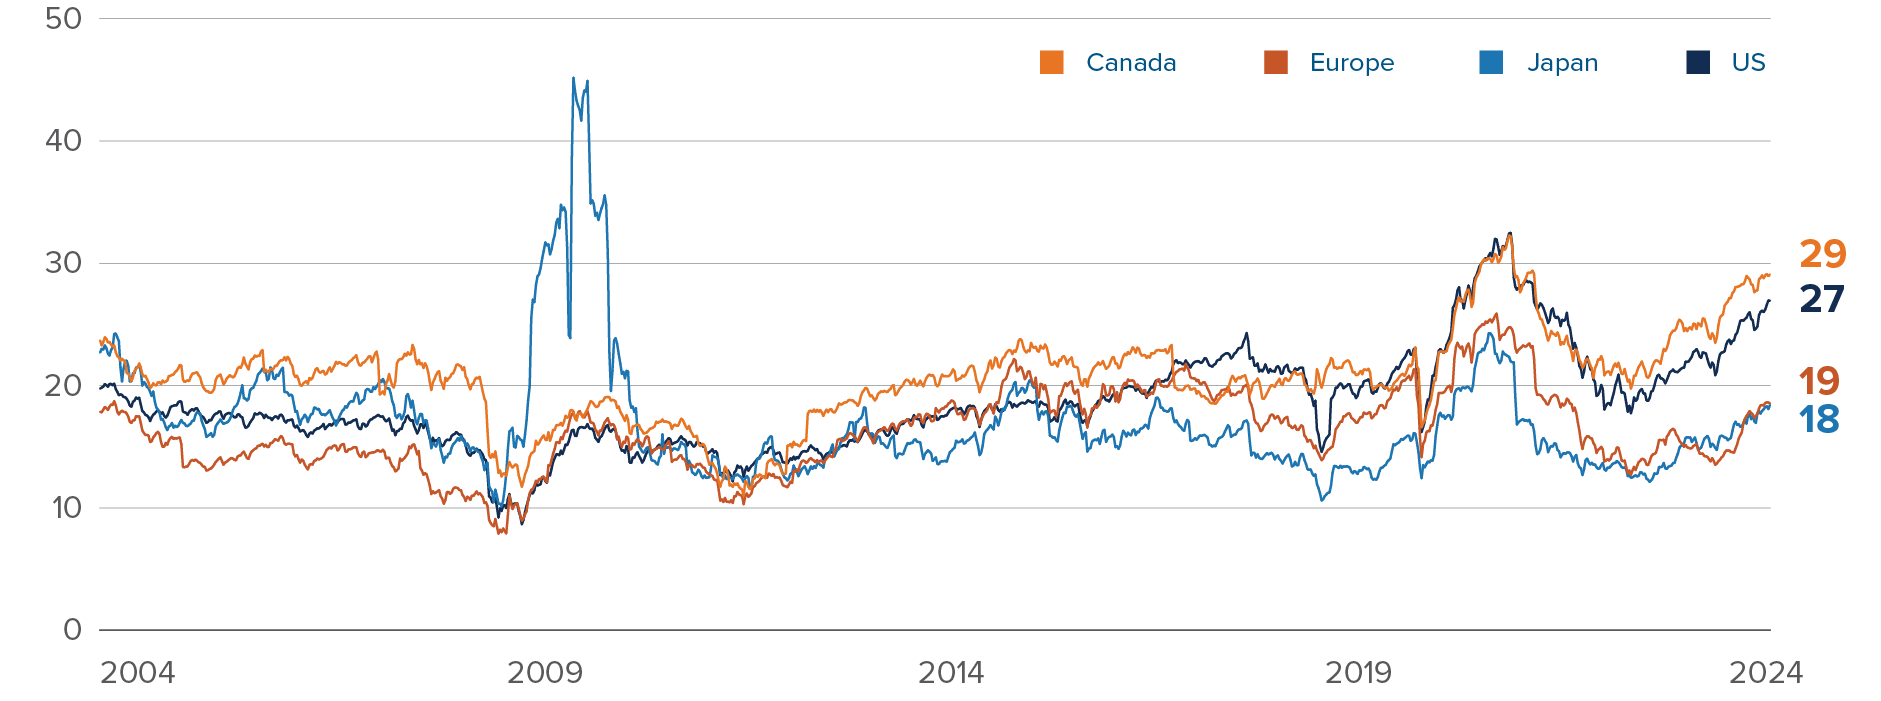
Source: Bloomberg. Calculations by the Mackenzie Multi-Asset Strategies Team
We prefer to turn to truly cheap markets (relatively speaking), like Europe and Japan. As opposed to Canadian stocks, international stocks are cheap relative to the US, even after adjusting for sector exposures. Yes, international stocks will almost always be cheaper than US stocks. US stocks benefit from high liquidity, solid governance, persistent passive flows and natural currency diversification for unhedged investors. But the price discount in international markets is larger than it normally is, across nearly every sector.
Japan combines catalysts and decent valuations
Earnings yield, US minus Japan stocks, today vs. average
Some of our favourite international stock markets — like Italy and Japan, two of the best-performing markets year-to-date — combine extremely attractive valuations and positive catalysts. Japanese companies are investing after years of hoarding cash and benefitting from tailwinds in artificial intelligence and advanced manufacturing. Italian companies are seeing windfalls from the European Central Bank’s implicit backing of Italian government debt and benefitting from Italy’s recent continent-leading economic growth. But it’s mostly a valuation argument: faced with current expensive global stock markets, we don’t de-risk; we diversify. As a result, we overweight international equities in the Mackenzie All-Equity ETF Portfolio. We’re also long Japanese and select European markets, and short the TSX in the Mackenzie Global Macro Fund.
Capital markets update
What we’ll be watching in July
July 24: Bank of Canada rate decision
- While the Consumer Price Index data released on June 25 showed that Canadian inflation picked up in May, the longer-term trend remains one of slowing inflation and a deteriorating labour market. Odds are that Canada is currently in the midst of a recession, even if data hasn’t confirmed it yet.
- The Bank of Canada could decide to hold rates at its July meeting, skipping a meeting to keep consumers and businesses on their toes and avoid a spiral of rate cut expectations. But the data still prescribes lower rates. We expect between two and three additional cuts in 2024.
July 25: US Q2 gross domestic product
- The Atlanta Fed Nowcast model expects Q2 gross domestic product growth to come in at 1.7%, solidly above zero, but below the “potential” long-term rate for the US economy.
- The US economy has been in an investment- and consumption-driven boom for the past few years, supported by elevated federal government spending. While we don’t see a US recession on the horizon — and haven’t been in that camp for many years — the US economy is clearly slowing, albeit from elevated levels.
July 30: Mexico Q2 gross domestic product
- The Mexican economy grew 1.2% annualized in the first quarter of 2024, a clear downshift in growth from the previous year.
- If the US economy keeps cooling, Mexico won’t remain unscathed. The Mexican economy thrived in 2022 and 2023, even as the Bank of Mexico raised its policy rate from 4% to 11.25%. The combination of a booming economy and sky-high interest rates sent the Mexican peso to new heights. With political risk flaring up in Mexico, all eyes will be on the Bank of Mexico in coming months.
Multi-Asset Strategies Team’s investment views
Tactical summary
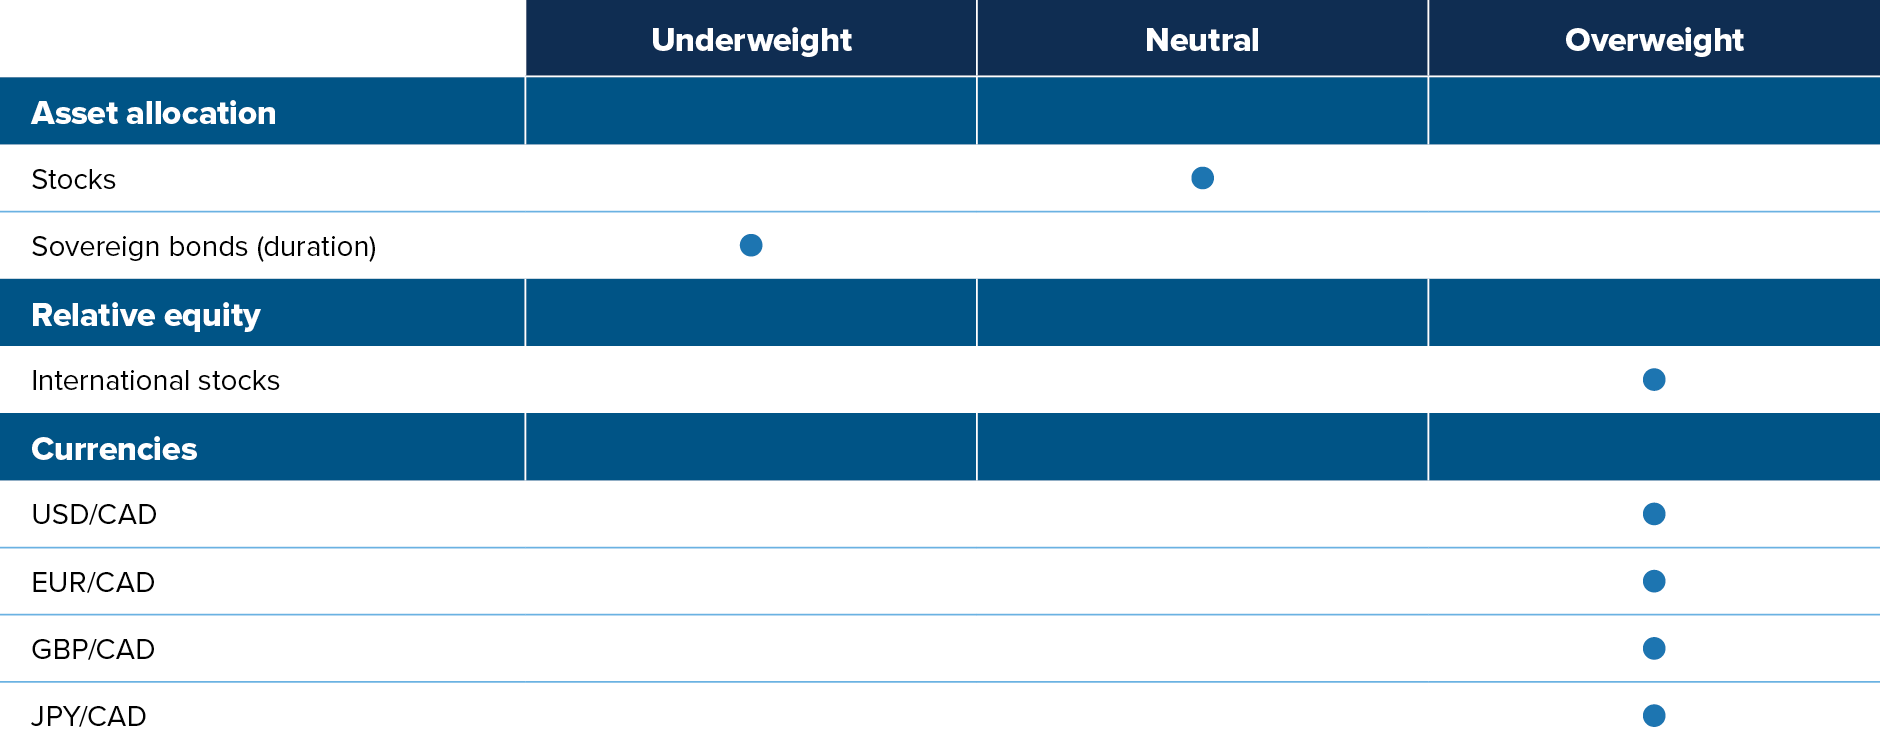
Note: The views expressed in this piece apply to products that are actively managed by the Multi-Asset Strategies Team.
Positioning highlights
Overvalued US assets: We generally don’t like US assets, whether equities or bonds. International stocks had a solid end to 2023, as expectations of US Federal Reserve interest rate cuts caused the US dollar to lose ground and international stocks to rally. Not only do international stocks generally have more attractive valuations than North American assets, but they should also benefit from promising macro catalysts ahead. The Italian and Japanese stock markets screen particularly well across the board.
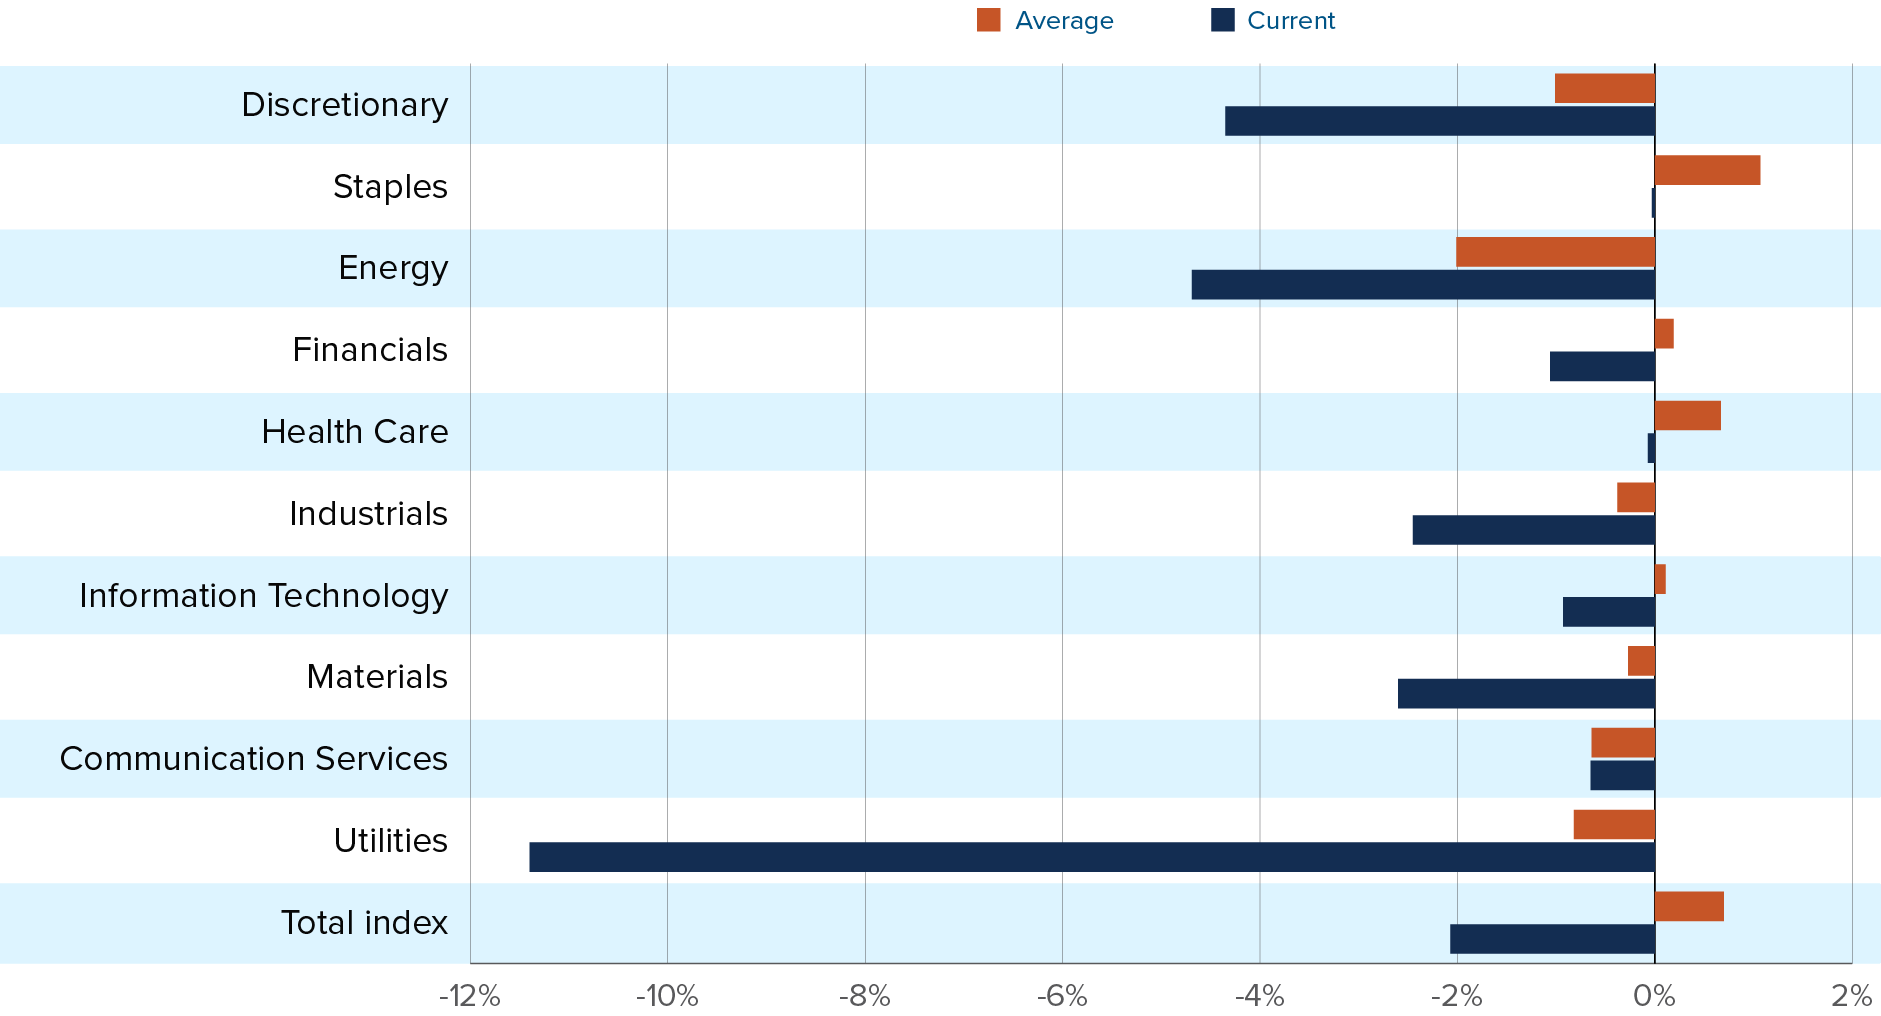
Moving to rate-sensitive sectors: Health care stocks look less attractive going forward. Health care was one the best-performing sectors in May, and the top positive contributor to our sector strategy. But we closed that position towards the end of May, with signs of deteriorating fundamentals starting to worry us. Analyst forecasts have turned down sharply. Plus, macro signals are favourable to more rate-sensitive sectors like real estate, which is now one of our favourite sectors.
Canadian landing: The macro situation in Canada is much more dire than in the US. The Canadian economy has an argument for the worst-performing economy in the first half of 2024. The job market is deteriorating quickly, especially when adjusting for working population growth and government hiring. We have been adding to our short Canadian dollar position, already one of the largest bets in the Mackenzie Global Macro Fund.
Commodity-exporting EM currencies: Commodity-exporting EMs are well situated to outperform in this macro environment. Their budgetary and external balances have improved amid high global nominal growth and high commodity prices. Their central banks started raising rates much earlier than the rest of the world. As a result, they have generally reached the end of their tightening cycle, reducing the risk of overtightening into a recession. But the level of rates remains high, offering positive carry over most other currencies. On the other hand, we hold a negative view on the currencies of Asian EM countries. Their external positions have severely deteriorated and their interest rates are relatively low.
Oil is poised for a rebound: Rising odds of a Trump presidency means higher likelihood of disruptions to global trade and rising macro uncertainty. Both would trigger precautionary demand for oil. Plus, Joe Biden has presided over one of the largest expansions in US oil production volumes in history. Hence, a Trump presidency shouldn’t be seen as a positive shock to domestic oil production.
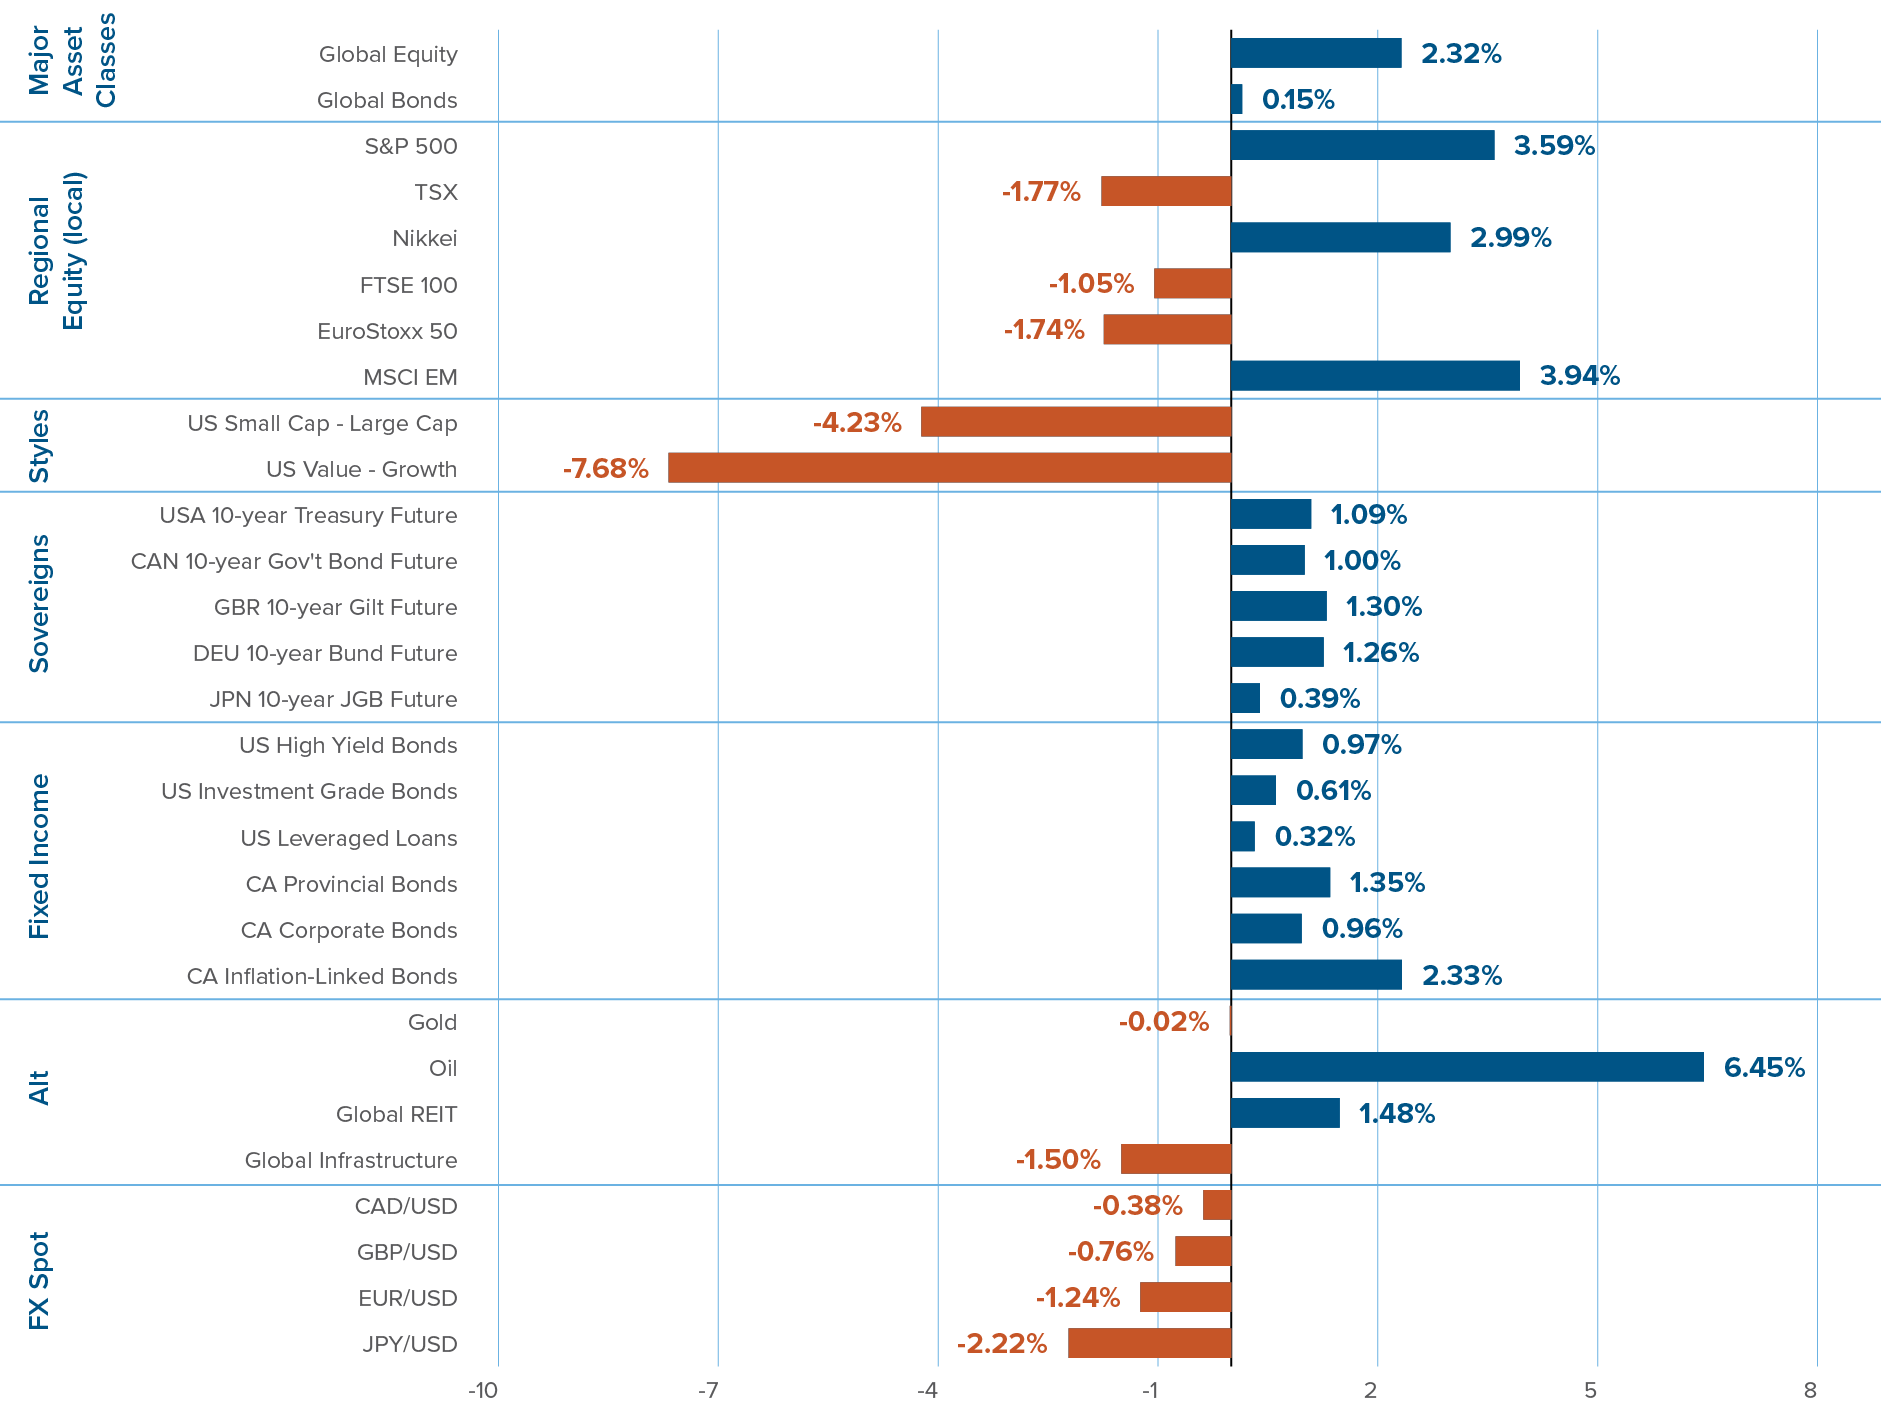
Capital market returns in June