

I know that this is an odd question to ask, because obviously ETFs can’t play football, but stay with me as I believe the analogy I’m going to make is interesting. At least for those of us who love investing and sports analogies.
When the Philadelphia Eagles were crowned champions, I asked myself, why did they win? There’s a famous saying “defence wins championships”, and it appears to hold true on average in the NFL championship. This year, both Kansas City and Philly were ranked top four in defence, with Philly being ranked number 2, and over the last 59 years the winning team has had a defence ranked sixth on average. This might be more than just a “saying” after all.
Defence wins championships
Okay, so how do we make this connection to ETF investing? Well, let’s first define how the scoring system works in football and investing terms.
In football, if you are down 10 points, how many points do you need to tie the game? Sounds like I’m setting you up for a trick question, but I’m not: it’s 10 points. In other words, it’s symmetrical. If your defence allows the opposing team to score 50 points, your offence now needs 50 points to tie the game.
However, in the investing world this is not always the case, as seen in Chart 1.
Chart 1: Making up for the large losses can be difficult
 Source: Mackenzie Investments, 2025. For illustration purposes only, the chart shows what returns are needed to break even after experiencing a certain percentage of loss. Loss is showcased in red, and blue demonstrates the amount needed to break even.
When a team is down 20 points but needs 25 to tie the game, we’d call this asymmetric, because you eventually need much more offense to just tie the game or break even on your investment. Let’s look at an example.
If you had an investment of $100 and lost 50%, you now have $50. What return do you need to break even or “tie the game”? You now need $50, which is 100% of the current value of your money.
Now let’s look at some real-world examples in Chart 2 and search for a defence that we can send to the big game. Let’s examine how the broad MSCI World (Net) Index compares to the MSCI World Minimum Volatility (Net) Index from a “defensive” lens.
Chart 2: Low Volatility Index vs Broad Index During Crisis
 Source: Bloomberg Finance L.P., as of August 2024.
Carrying the analogy forward, the MSCI Minimum Volatility (Net) Index appears to be playing better defence compared to the MSCI World (Net) Index, since it allowed fewer “points” against in the time periods highlighted in Chart 2.
- Dot-com bubble
- MCSI World (Net) Index lost 45.3% and needed 82.8% to break even.
- MSCI Minimum Volatility (Net) Index lost 17.8% and will only need 21.7% to break even.
- 2008 crisis
- MCSI World (Net) Index lost 57.4% and needed 134.7% to break even.
- MSCI Minimum Volatility (Net) Index lost 47.9% and need 91.9% to break even.
Okay, so far, I think a case can be made for one of the teams having played better defence.
But what about the offence?
Of course, to ultimately win, you’re going to need to score some points. Chart 3 below considers how the MSCI World Minimum Volatility (Net) Index’s “offence” has fared on the upside:
Chart 3: MSCI World (Net) Index vs. MSCI World Minimum Volatility (Net) Index
(Since Common Inception: May 31, 1988)
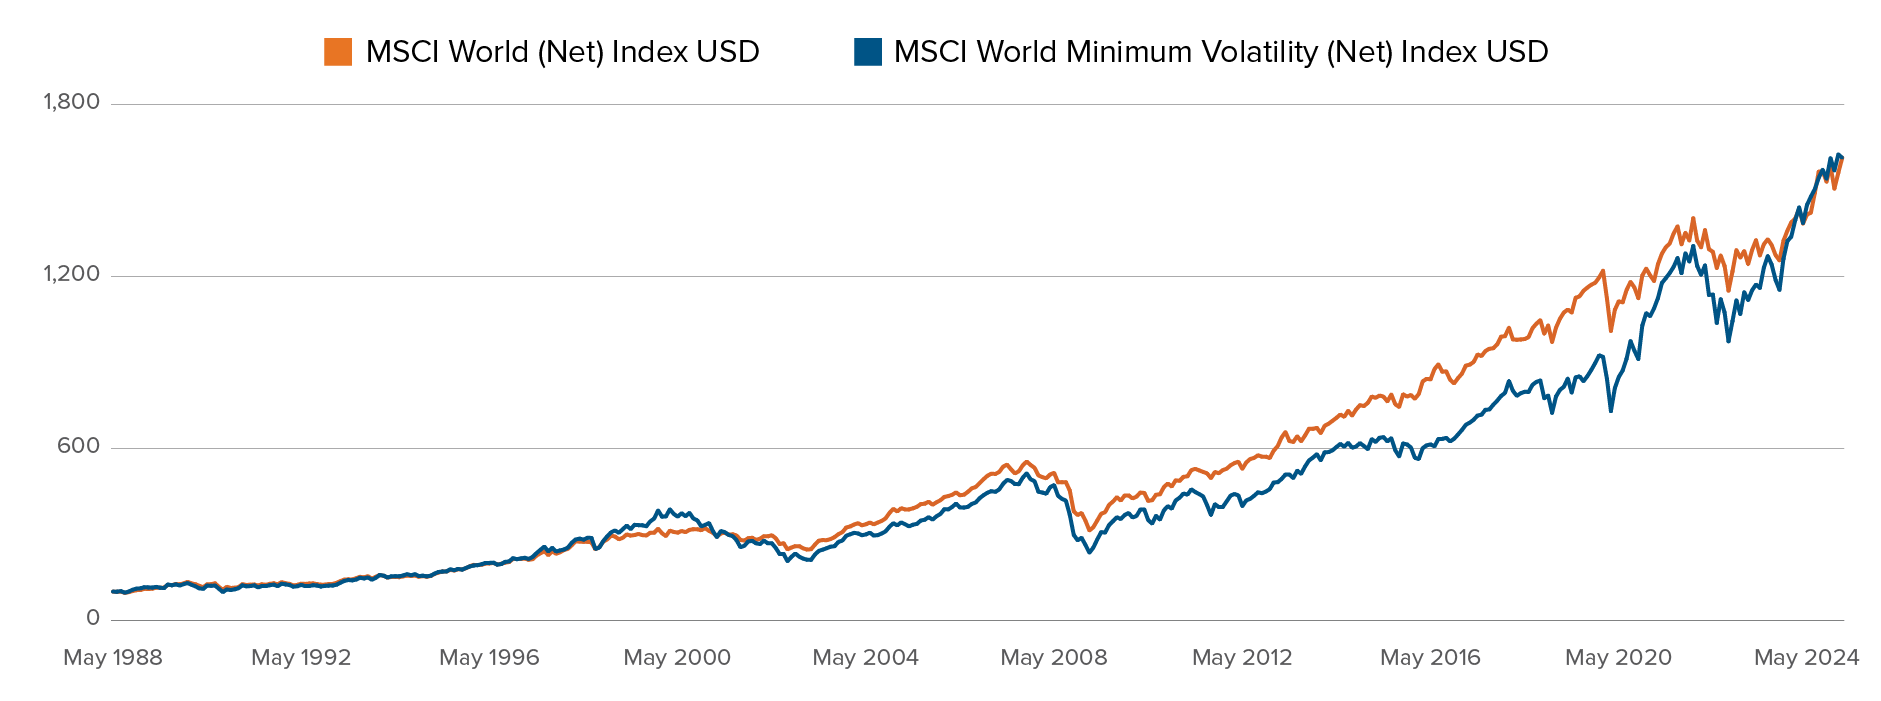 Source: Morningstar Direct, as at February 28, 2025. Chart shows the value of initial investment of $100 on May 31, 1988.
In Chart 3, the return of the MSCI Minimum Volatility (Net) Index closely resembles that of the MSCI World (Net) Index, with the MSCI Minimum Volatility (Net) Index occasionally delivering stronger returns, depending on the point in time where a given comparison is made.
Let’s look at this another way. As demonstrated by Chart 4, risk-reward charts plot the defence (standard deviation) and offence (returns) together. A lower standard deviation of returns indicates reduced volatility. Generally, reduced volatility corresponds to diminished downside risk relative to the broader market.
Chart 4: MSCI World vs. MSCI World Min Vol
(Since Common Inception: May 31, 1988)
 Source: Morningstar Direct, as at February 28, 2025.
Table 1
MSCI World (Net) Index |
MSCI World Minimum Volatility (Net) Index |
|
Return (offence) |
7.9 |
7.9 |
Standard deviation (defence) |
15.0 |
11.3 |
Return / standard deviation |
0.53 |
0.70 |
Source: Morningstar Direct, as at February 28, 2025.
Chart 4 and Table 1 suggest that the offence (returns) are similar for both indices. However, the defence (standard deviation) for the MSCI Minimum Volatility (Net) Index appears ~33% less variable as compared to the MSCI World (Net) Index. Taking it back to our football analogy, who would you choose to send to the championship out of these two? The ability to select a team with similar offence, but a materially better defence could be very competitive.
Which ETF can you send to the big game?
In February 2024, Mackenzie Investments launched the Mackenzie World Low Volatility ETF (MWLV), managed by our Global Quantitative Equity Team which seeks to utilize low-volatility strategies to help investors stay in the market by aiming to reduce the impact of volatility on investor portfolios. The team has a strong track record of managing several investment options and low-volatility strategies across regions, using a quantitative approach that combines robust research and strong risk management to enhance investment decision-making.
Quick hits:
Name: |
Mackenzie World Low Volatility ETF |
Ticker: |
MWLV |
Inception date: |
February 20, 2024 |
Benchmark: |
MSCI World Minimum Volatility (Net) Index (Reminder: this was the orange dot from Chart 4). |
Goal: |
MWLV seeks to provide long-term capital growth by investing primarily in equity securities of large and mid-capitalization companies in developed global markets, while seeking to provide lower volatility. |
Management fee: |
0.50% |
Risk rating: |
Low-to-medium |
Style: |
Active fundamental quant. |
While we are still in the first quarter of the game, as MWLV has just crossed it’s one-year mark, it has delivered 24.15 in the last year. By prudently applying innovative technologies to our stock selection process, we believe the Mackenzie Global Quantitative Equity Team is well-positioned to navigate low-volatility investing in today’s market landscape.
Chart 5: A fantastic "first quarter" for MWLV
Feb 21, 2024 - March 1, 2025

Ticker |
Name |
Inception date |
Return 1 year |
Since Inception |
MWLV |
Mackenzie World Low Volatility ETF |
Feb 20, 2024 |
24.15 |
25.50 |
Time to make your pick
In the first half of this blog, we compared the MSCI Minimum Volatility (Net) Index against the MSCI World (Net) Index and considered the standard deviation (defence) and offence (returns) of both indices. While you cannot invest directly in the MSCI Minimum Volatility (Net) Index, you can invest in a passive ETF that tracks an index or an active ETF that seeks to outperform it. MWLV is an active ETF that aims to operate with lower volatility than global developed markets over time and seeks to deliver volatility similar to or below that of the MSCI World Minimum Volatility (Net) Index.
Who will you choose?
To learn more about the Mackenzie World Low Volatility ETF (MWLV) click here.
In addition, listen to our recent podcast on the case for low volatility ETFs (Spotify) (Apple).
Commissions, management fees, brokerage fees and expenses may all be associated with Exchange Traded Funds. Please read the prospectus before investing. The indicated rates of return are the historical annual compounded total returns including changes in unit value and reinvestment of all distributions, and do not take into account sales, redemption, distribution, or optional charges or income taxes payable by any security holder that would have reduced returns. Exchange Traded Funds are not guaranteed, their values change frequently, and past performance may not be repeated.
Index performance does not include the impact of fees, commissions, and expenses that would be payable by investors in the investment products that seek to track an index.
The content of this article (including facts, views, opinions, recommendations, descriptions of or references to, products or securities) is not to be used or construed as investment advice, as an offer to sell or the solicitation of an offer to buy, or an endorsement, recommendation or sponsorship of any entity or security cited. Although we endeavour to ensure its accuracy and completeness, we assume no responsibility for any reliance upon it.
Standard deviation provides a measure of the variability of returns that have occurred relative to the average return. The higher the standard deviation, the greater is the range of returns that has been experienced. Standard deviation is commonly used as a measure of risk.
This article may contain forward-looking information which reflect our or third-party current expectations or forecasts of future events. Forward-looking information is inherently subject to, among other things, risks, uncertainties and assumptions that could cause actual results to differ materially from those expressed herein. These risks, uncertainties and assumptions include, without limitation, general economic, political and market factors, interest and foreign exchange rates, the volatility of equity and capital markets, business competition, technological change, changes in government regulations, changes in tax laws, unexpected judicial or regulatory proceedings and catastrophic events. Please consider these and other factors carefully and not place undue reliance on forward-looking information. The forward-looking information contained herein is current only as of August 2024. There should be no expectation that such information will in all circumstances be updated, supplemented or revised whether as a result of new information, changing circumstances, future events or otherwise.
©2025 Morningstar. All Rights Reserved. The information contained herein: (1) is proprietary to Morningstar and/or its content providers; (2) may not be copied or distributed; and (3) is not warranted to be accurate, complete or timely. Neither Morningstar nor its content providers are responsible for any damages or losses arising from any use of this information. Past performance is no guarantee of future results.